Chinook Season: What to Expect When You are Expecting
Every summer we eagerly wait for the fish count numbers to come back to us as fish climb the ladders over Daguerre Point Dam in the lower Yuba River. These numbers help us predict how many Chinook salmon we can expect to return to their spawning grounds in the 24 mile stretch of the Yuba below Englebright Dam.
As fish jump through the ladders they are photographed and later identified by a biologist hired by the Yuba River Management Team.[1] River flows and temperature are closely monitored each year, having been designed through a collaborative process that evaluated beneficial river flows for fish and people.[2] SYRCL still advocates for improved flows, as the science underpinning what we know about what salmon need is ever evolving.
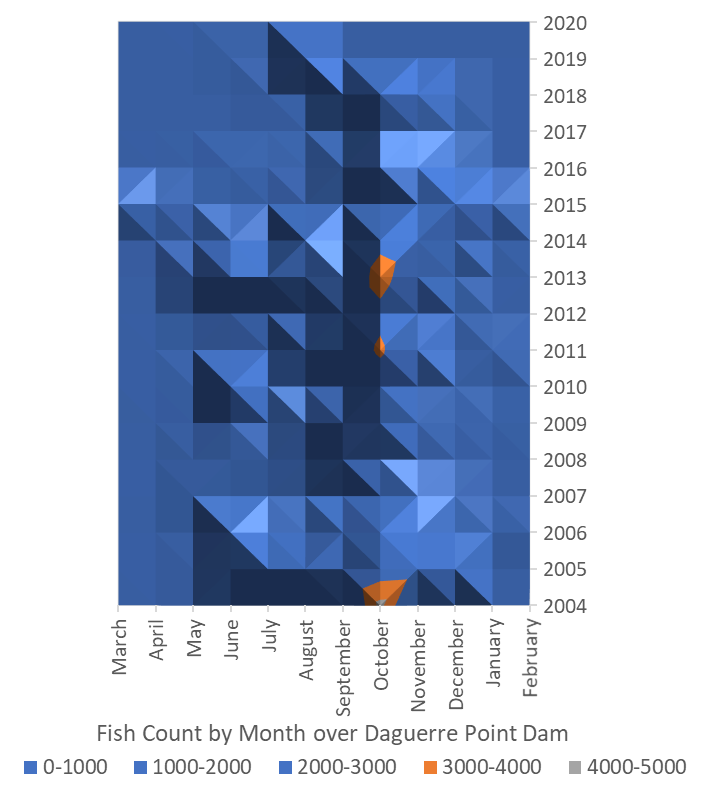
Looking at the data, we see that every year is very different. There are good years (2004, 2005, 2011, 2012, 2013, 2014) and there are bad years (2006, 2007, 2008, 2009, 2010, 2015, 2016, 2017, 2018, 2019?).
Figure 1 paints a picture of how many fish have passed over Daguerre Point Dam on a monthly basis from 2004 through mid-September of this year (some data may be provisional). The high points on the map-graph are indicative of times where more salmon have passed. The low, blue valleys are times when fewer salmon have passed.
Salmon aren’t returning from the ocean in the January through May period, because that is when their eggs hatch and the juveniles start to feed, grow, and return to the ocean to become adults.[3] By June, some years see thousands of fish returning to the river, while others see none.
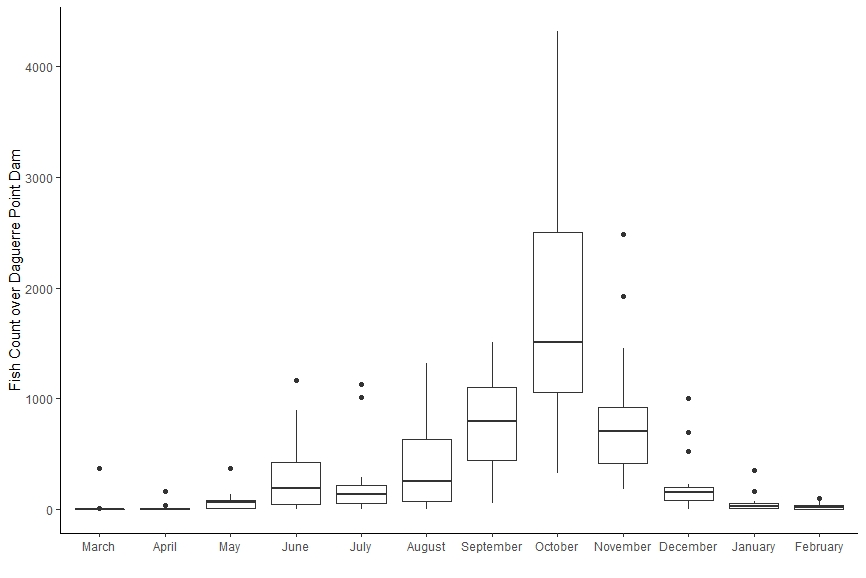
The big time for salmon in the Yuba River is September through November, when upwards of 4,000 fish have been documented passing over Daguerre Point Dam (Figure 2).
By August, we like to see a few hundred, if not a thousand Chinook salmon pass over Daguerre Point Dam. Again, while this is not the total number of salmon that come home to the Yuba River each year, it allows us to start to estimate the number that make it up the first several miles and keep going in search of better spawning gravels.
Some people believe that the early salmon count (before September and October) is indicative of the Spring Run component of our salmon run. However, differentiating the spring run vs. the fall run is a complex issue as the two populations intermingle in the lower Yuba River, muddling the genetics that make them distinct from one another.
Over the last few years, we’ve waited patiently as the numbers have trickled in. As we recover from what some refer to as the driest period since we began tracking such information[4], we have waited even more patiently. The counts in 2017 and 2018 were on par with those in 2007-2008, the period known as the Sacramento River Fall Run Chinook Collapse.[5]
This year, we felt hopeful, but are now waiting with more anticipation than patience to see if 2019 will turn out more like 2011, a wet year when fish seemed to keep us waiting but then resulted in 6,331 fish passing over Daguerre Point Dam. Or will 2019 be a continuation of 2016, 2017 and 2018, with the counts falling short of expectations and further threating the genetic integrity of the Yuba Salmon stock?
In addition, Yuba Salmon are competing with hatchery fish[6], which can be identified because many of the fish released from a hatchery have had their adipose fin clipped. The replacement of genetically similar hatchery fish and loss of distinct Yuba Salmon, or Central Valley Chinook on a larger scale, decreases the overall genetic diversity of salmon in California which could make them more vulnerable to stressors, like disease and climate change.
This year, like many between 2004 and 2019, there are caveats to the salmon count data that are being painstakingly collected. The high flows in 2019 damaged the North fish ladder at Daguerre Point Dam, halting passage by any salmon waiting below.
In mid-September, the Army Corps of Engineers finally fixed this problem and within in the first ten days of the North fish ladder being open, over 600 fish flooded through. We don’t know how that impacted the fish as they made their journey from the sea to their spawning grounds.
In other years, the cameras within the fish ladders have been damaged or compromised, and fish that climb the ladders go uncounted (if a fish climbs a ladder and no one is there to see it, did it actually happen?).
Preparing for the Unexpected
The fact is, our Yuba Salmon are experiencing a low period in their thousands of years of history in the Yuba River watershed. How we come together today and improve their habitat from the headwaters all the way to the ocean will either save or further threaten this species, which is one among thousands that rely on rivers, floodplains, estuaries, and oceans to survive.
 Close to home, SYRCL and partners are restoring key sites along the lower Yuba River — like Hammon Bar, Hallwood, and Long Bar — to create more than 200 acres of high quality seasonally inundated habitat over the next 5 years.[7]
We work collaboratively with the Yuba River Management Team to track fish populations and work on solutions for issues by monitoring infrastructure and helping to define monitoring goals. We advocate for improved river flows through the FERC relicensing process[8] and with our Foothills Water Network partners.
We continue to hold the long-term vision that fish will make it into the upper forks of the Yuba River by the power of their own fins.[9] This is the only long term solution if we want to see a fish population that has enough genetic diversity to withstand annual and long term variation in temperature, river flows, and oceanic conditions.
[1] https://www.yubawater.org/191/Lower-Yuba-River-Management-Team-RMT
[2] https://www.ppic.org/blog/the-yuba-accord-a-model-for-water-management/
[3] https://www.westcoast.fisheries.noaa.gov/publications/habitat/fact_sheets/floodplains_fact_sheet_031114.pdf
[4] https://www.ppic.org/publication/californias-latest-drought/
[5] https://s3.amazonaws.com/newsdeeply/waterdeeply/public/NOAA+2009+Report+on+Salmon+Crash.pdf
[6] https://fishbio.com/field-notes/the-fish-report/clips-codes-many-central-valley-salmon-come-hatcheries
[7] https://yubariver.org/our-work/restoration/lower-yuba-restoration/
[8] https://yubariver.org/issues/dam-licensing/the-yuba-river-development-project/
Did you enjoy this post?
Get new SYRCL articles delivered to your inbox by subscribing to our ENews.